


Download Visual Budget Easy – Free Visual Budgeting Tool for Windows, Mac & Mobile
Overview
Visual Budget Easy is a straightforward budgeting application that turns the classic manual‑entry process into a visual experience. Unlike automated expense trackers that pull data from banks, Visual Budget Easy keeps the hands‑on feel of a spreadsheet while automatically generating charts, graphs, and year‑long visualizations of your cash flow. The interface is clean, the graphics are vivid, and the learning curve is shallow, making it an appealing choice for anyone who enjoys the control of manual budgeting but wants a quick visual snapshot of where their money is going.
The free version acts as a demo—it showcases the charting engine but limits the number of entries you can store, so it’s not a full‑featured budgeting solution without an upgrade. Nevertheless, for users who already maintain a budget in a spreadsheet or a handwritten ledger, Visual Budget Easy provides a natural upgrade path: keep the manual data entry you trust, and let the software instantly draw line charts, bar graphs, and cash‑flow diagrams that update as you add new rows. If you are looking for a “set‑and‑forget” finance manager that automatically syncs with your bank, this tool may feel too labor‑intensive.
However, for budget‑conscious individuals who love to see their numbers visualized in real time, Visual Budget Easy delivers exactly what its name promises—easy visual budgeting without sacrificing the tactile satisfaction of manual entry.
Key Features of Visual Budget Easy
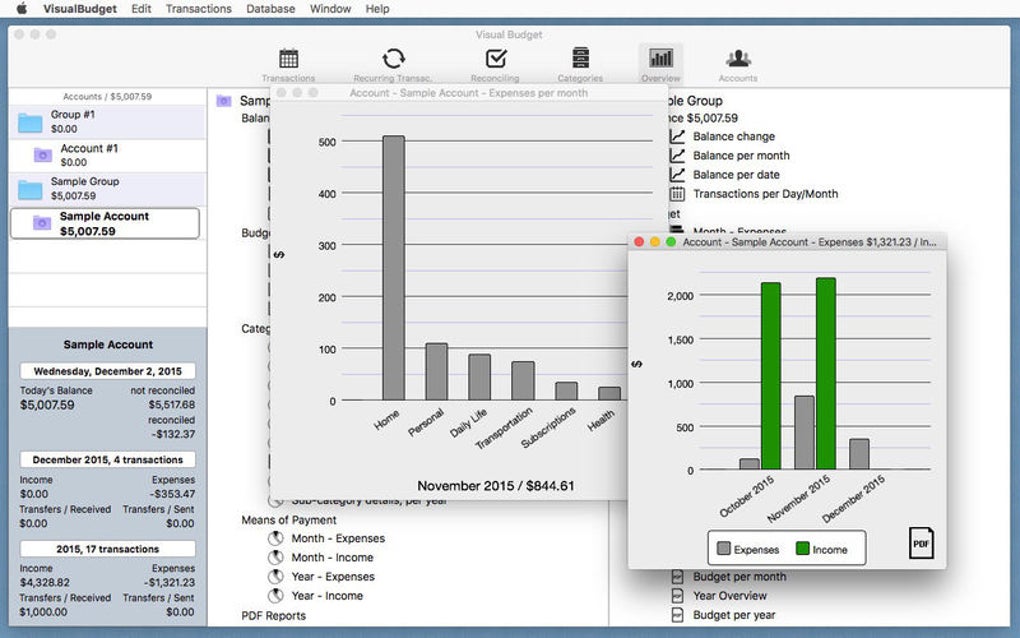
- Dynamic Year‑Long Graphs: Auto‑generated line and bar charts illustrate monthly income, expenses, and net balance across an entire fiscal year.
- Customizable Categories: Users can create unlimited expense and income categories, assign colors, and group them for clearer visual breakdowns.
- Simple Entry Interface: A spreadsheet‑like input grid lets you add dates, descriptions, amounts, and categories with just a few clicks.
- Export & Import Options: Export your budget data to CSV or import existing spreadsheets for a seamless transition.
- Multi‑Platform Support: Native applications for Windows, macOS, Android, and iOS keep your visualizations synchronized across devices.
- Print‑Ready Reports: Generate PDF summaries of your charts and tables for meetings, tax prep, or personal review.
- Free Demo Mode: The free version lets you explore the visual engine with a limited number of entries, perfect for testing before purchasing the full license.
- Secure Local Storage: All budget data is saved locally on your device, giving you full control over privacy without cloud dependency.
Installation, Usage & Compatibility
Getting Visual Budget Easy up and running is intentionally simple. After you download the installer for your operating system, double‑click the file and follow the on‑screen prompts. Windows users will receive an .exe installer, macOS users an .dmg package, and mobile users can install the app directly from the Google Play Store or Apple App Store. The installation process typically completes in under two minutes, and the first launch presents a brief tutorial that walks you through creating your first budget sheet.
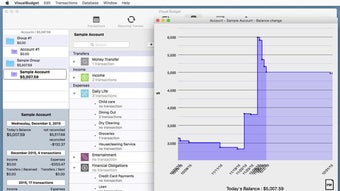
Once installed, the workflow mirrors a traditional spreadsheet: click “New Budget,” set your fiscal year, and begin adding rows for each transaction. Each row requires a date, description, amount (positive for income, negative for expense), and a category selector. As you populate the grid, the right‑hand panel instantly updates with a line chart of cumulative balance, a bar chart of monthly spending, and a pie chart of category distribution. You can toggle between monthly, quarterly, or yearly views with a single click, and the charts automatically adjust to reflect any edits.
Supported Platforms: Visual Budget Easy runs on Windows 10/11 (64‑bit), macOS 10.14 or later, Android 6.0+, and iOS 13+. The desktop versions require at least 200 MB of free disk space and a graphics driver capable of rendering SVG charts. Mobile versions are optimized for both phones and tablets, with touch‑friendly controls for adding and editing entries.
For power users, the application includes a “Data Refresh” button that re‑calculates all visualizations after bulk imports, ensuring that large CSV uploads do not lag the UI. The program also supports keyboard shortcuts (Ctrl+N for new budget, Ctrl+S to save, Ctrl+Z to undo) to speed up data entry. If you prefer to keep your budget private, you can enable the optional password protection feature under Settings → Security, which encrypts the local data file with AES‑256 encryption.
Conclusion – Pros, Cons, FAQ & Call to Action
Pros
- Excellent visual feedback makes it easy to spot trends at a glance.
- Retains the manual‑entry control that spreadsheet lovers appreciate.
- Cross‑platform availability ensures consistency across desktop and mobile.
- Local‑only storage guarantees privacy without relying on cloud services.
- Export to CSV and PDF facilitates sharing and archival.
Cons
- Free version is limited to a small number of entries, which may feel restrictive.
- No automatic bank import; all data must be entered manually.
- Drilling down to identify the exact expense that caused a red balance requires navigating the table, not the charts.
- Advanced analytics (e.g., forecasting) are not included.
- Requires a paid upgrade for unlimited entries and full feature set.
Frequently Asked Questions
Is Visual Budget Easy suitable for beginners?
Yes. The interface mimics a simple spreadsheet, and the onboarding tutorial guides new users through creating their first budget, making it accessible even for those without prior budgeting software experience.
Can I sync my data across multiple devices?
Data is stored locally on each device. While there is no built‑in cloud sync, you can manually export the CSV file from one device and import it on another to keep budgets consistent.
What does the free version limit?
The free demo allows up to 20 transaction entries. This is enough to test the charting capabilities, but you’ll need the paid license for unlimited budgeting throughout the year.
Is my financial data safe?
All data is saved locally and never transmitted to external servers unless you choose to export it. Optional password protection encrypts the file with AES‑256, adding an extra layer of security.
Can I customize the look of the charts?
Yes. The Settings menu lets you change color palettes, toggle grid lines, and choose between line, bar, or area chart styles for each visualization.
Final Thoughts & Call to Action
Visual Budget Easy fills a niche that many modern finance apps overlook: the desire for a hands‑on budgeting process combined with instant visual feedback. If you already enjoy crafting budgets in spreadsheets and simply want a more colorful way to monitor progress, this tool is a perfect fit. The paid version unlocks unlimited entries, advanced chart options, and the ability to export polished reports—features that make the modest price worthwhile for serious budgeters. To experience the visual power yourself, download Visual Budget Easy today, try the free demo, and decide if the upgrade aligns with your financial tracking goals.